Explore available audit log data
Audit logs support a variety of data fields collected from HelloID. Follow these instructions to explore the available data fields.
Open audit logs in Discover mode
Go to Insights > Elastic Reports.
Click Report Management.

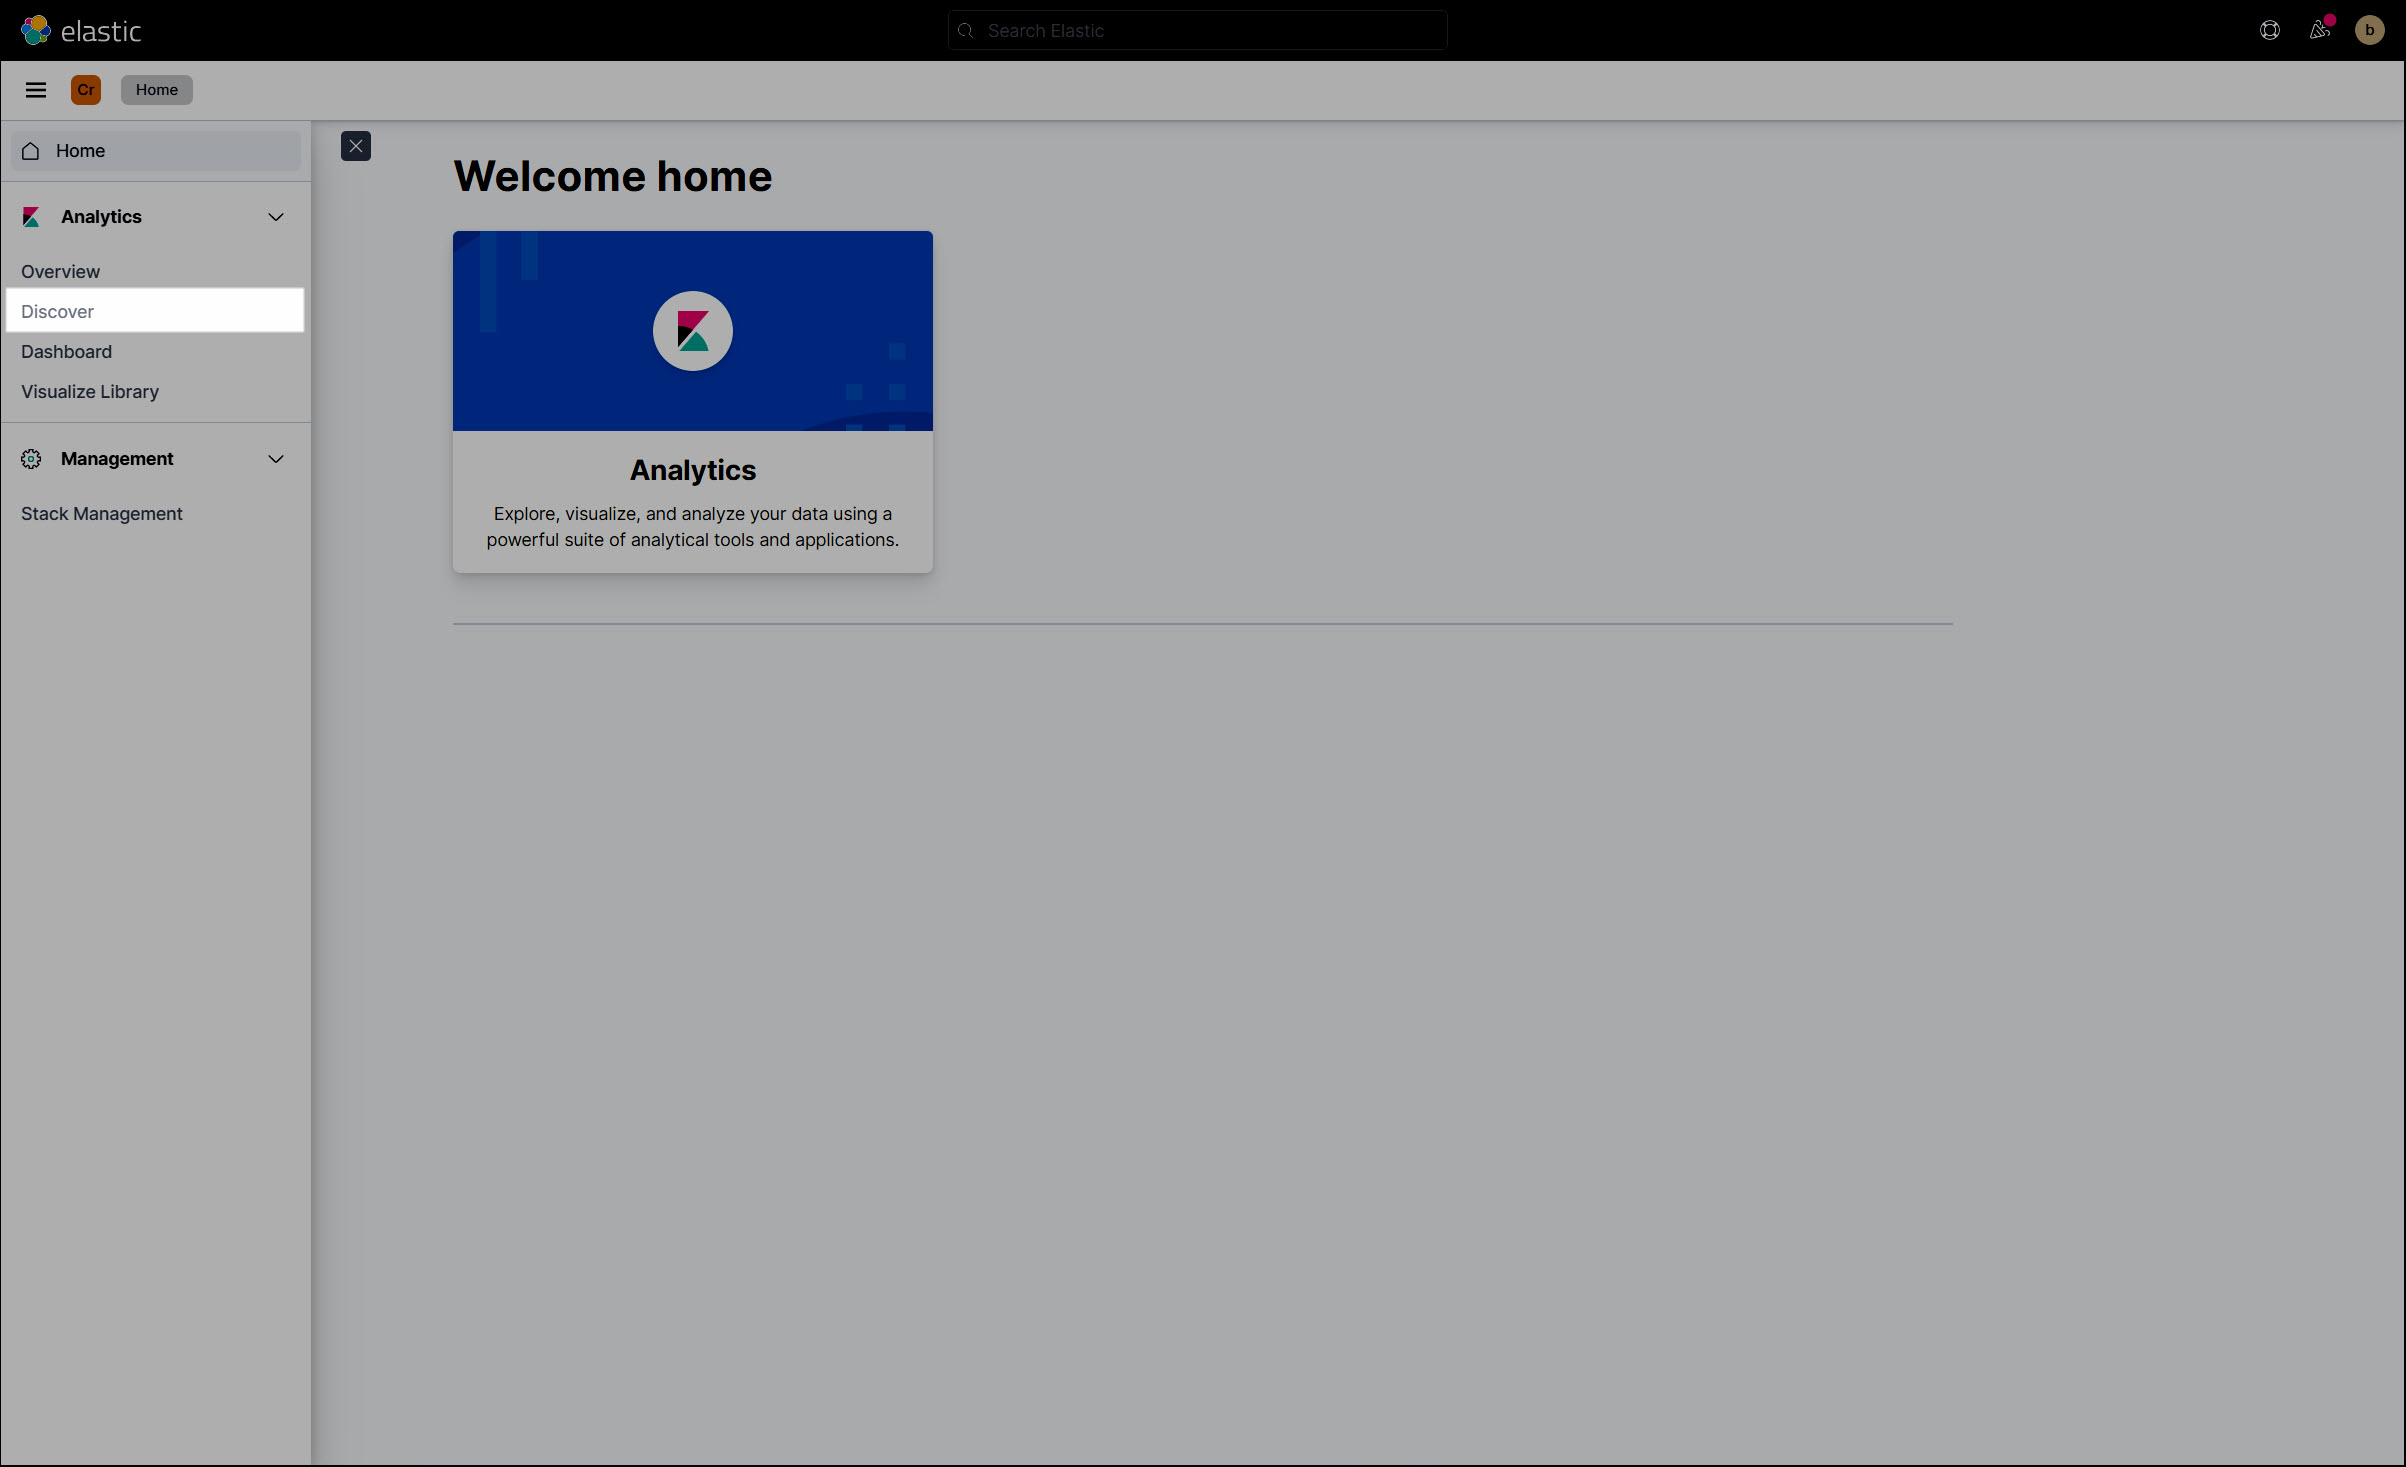
You are redirected to Elastic.
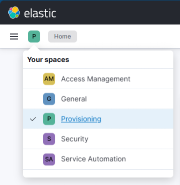
Select a custom report space that you created previously.
For this example,
Marketing.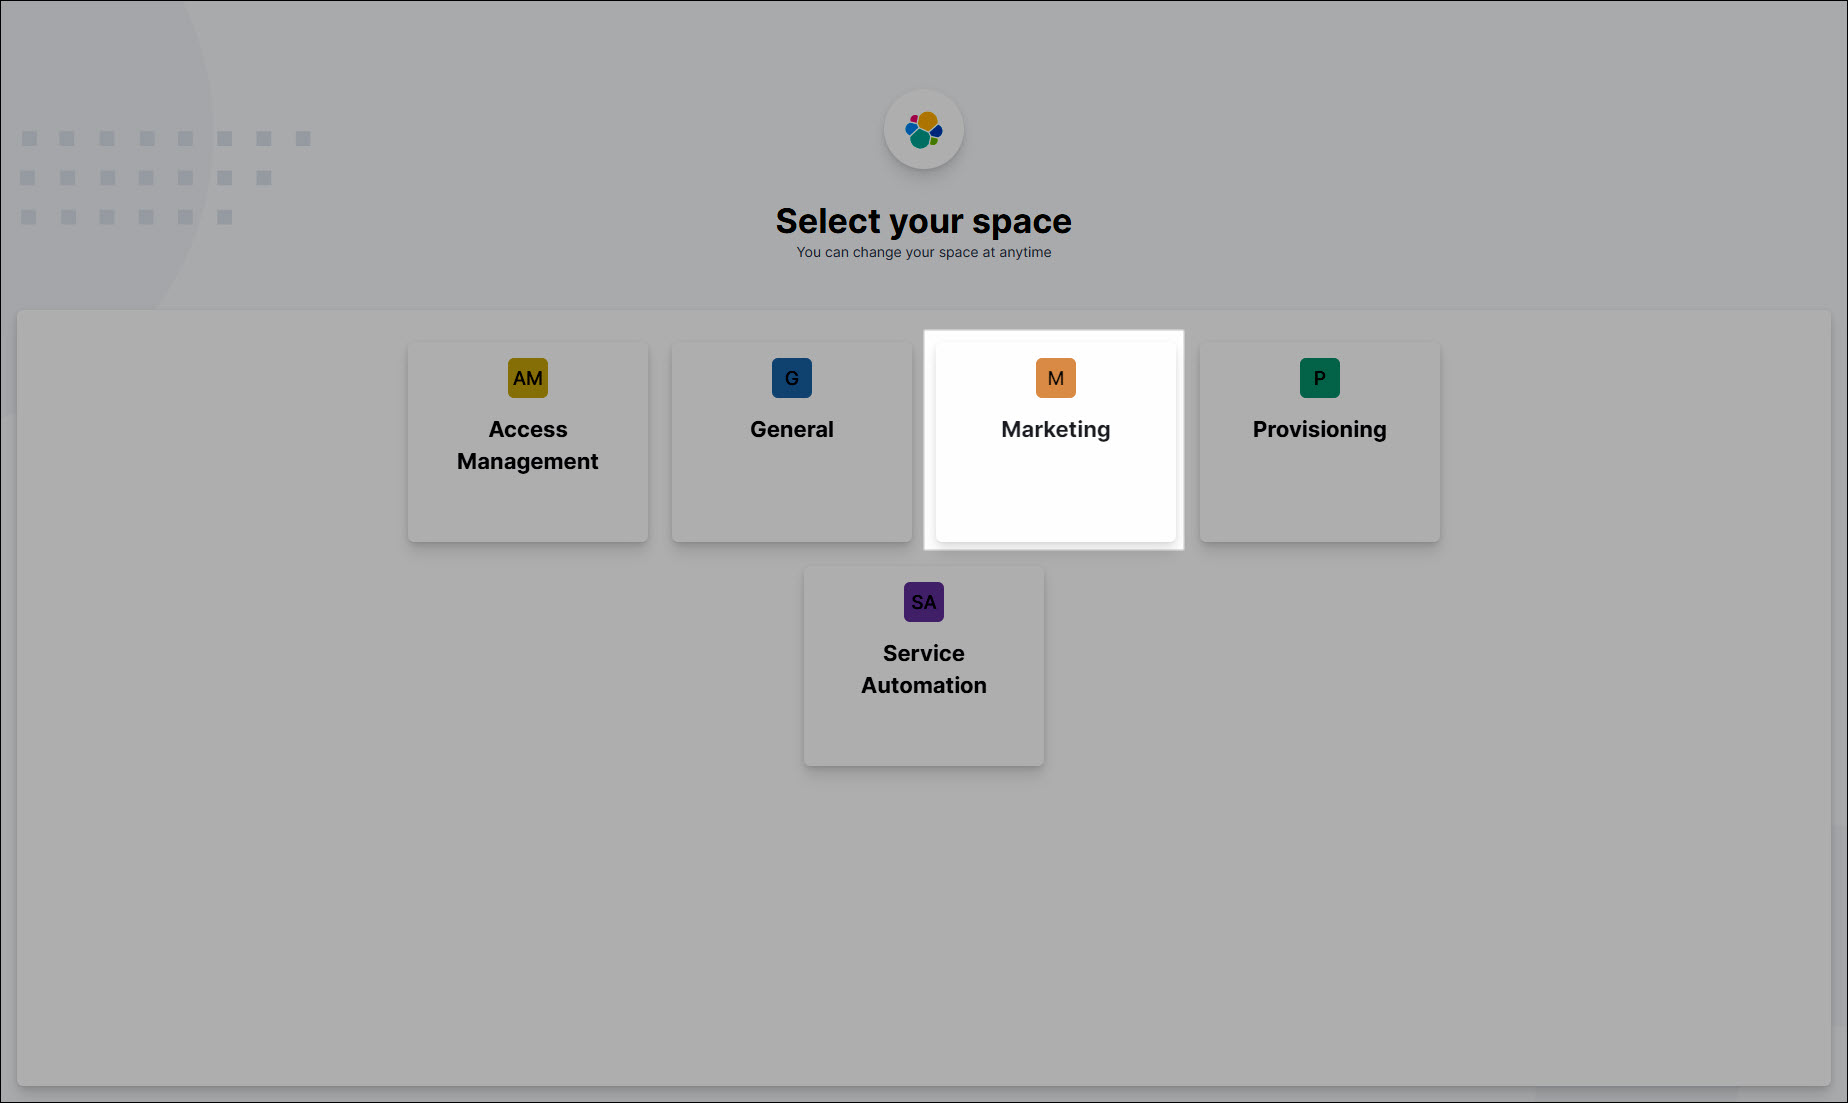
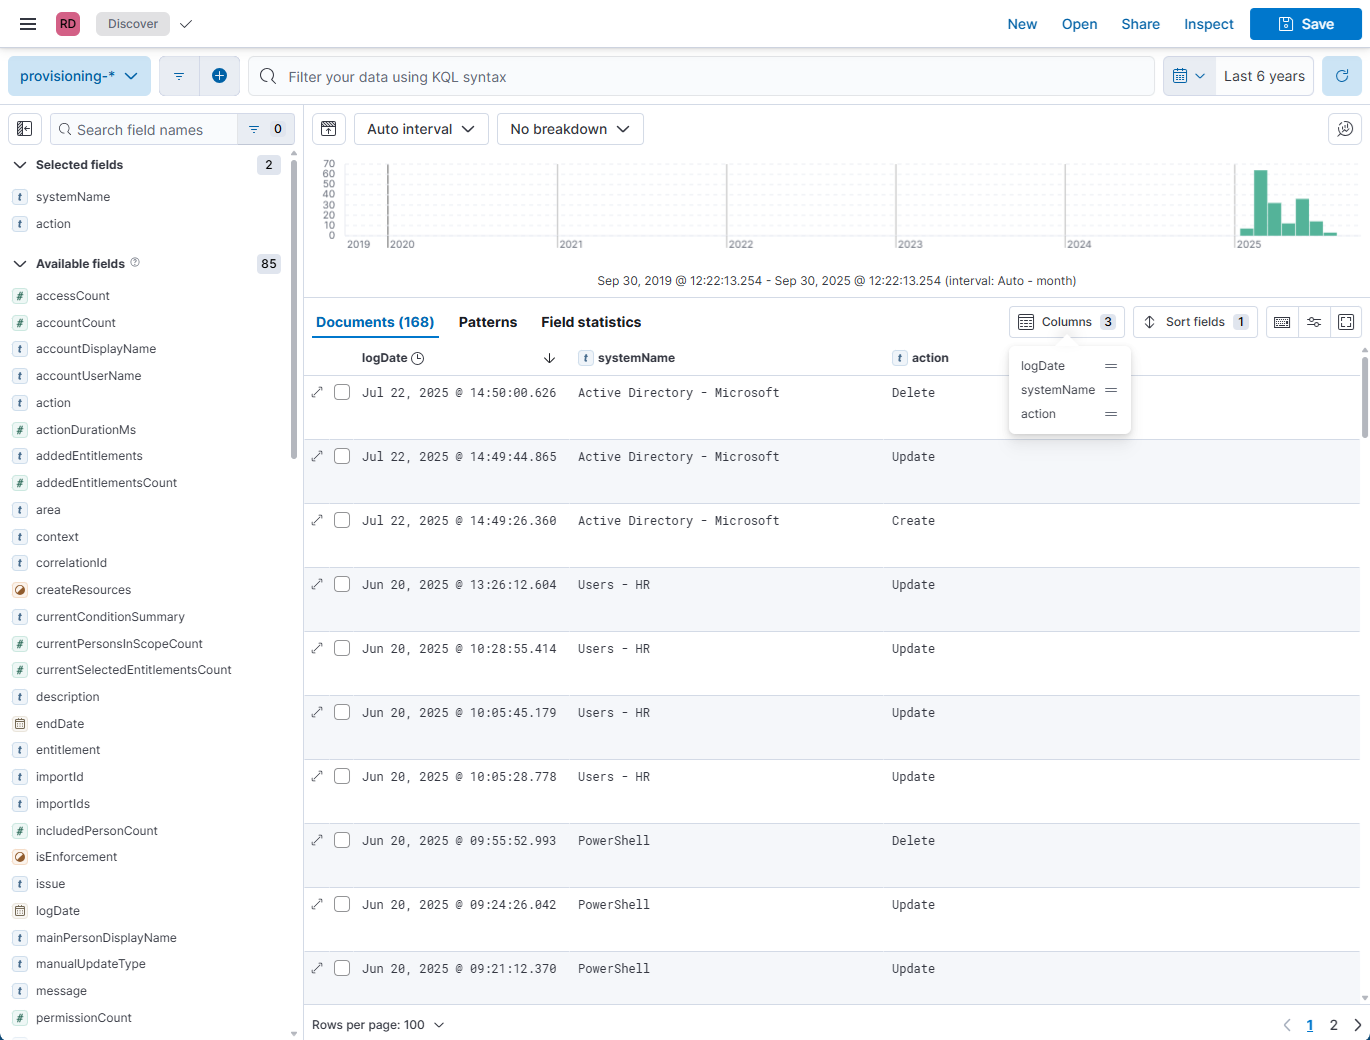
Expand the left-hand menu and click Discover.
Click the calendar icon in the top-right corner. Increase the data range.
We'll change it to
Last 1 year.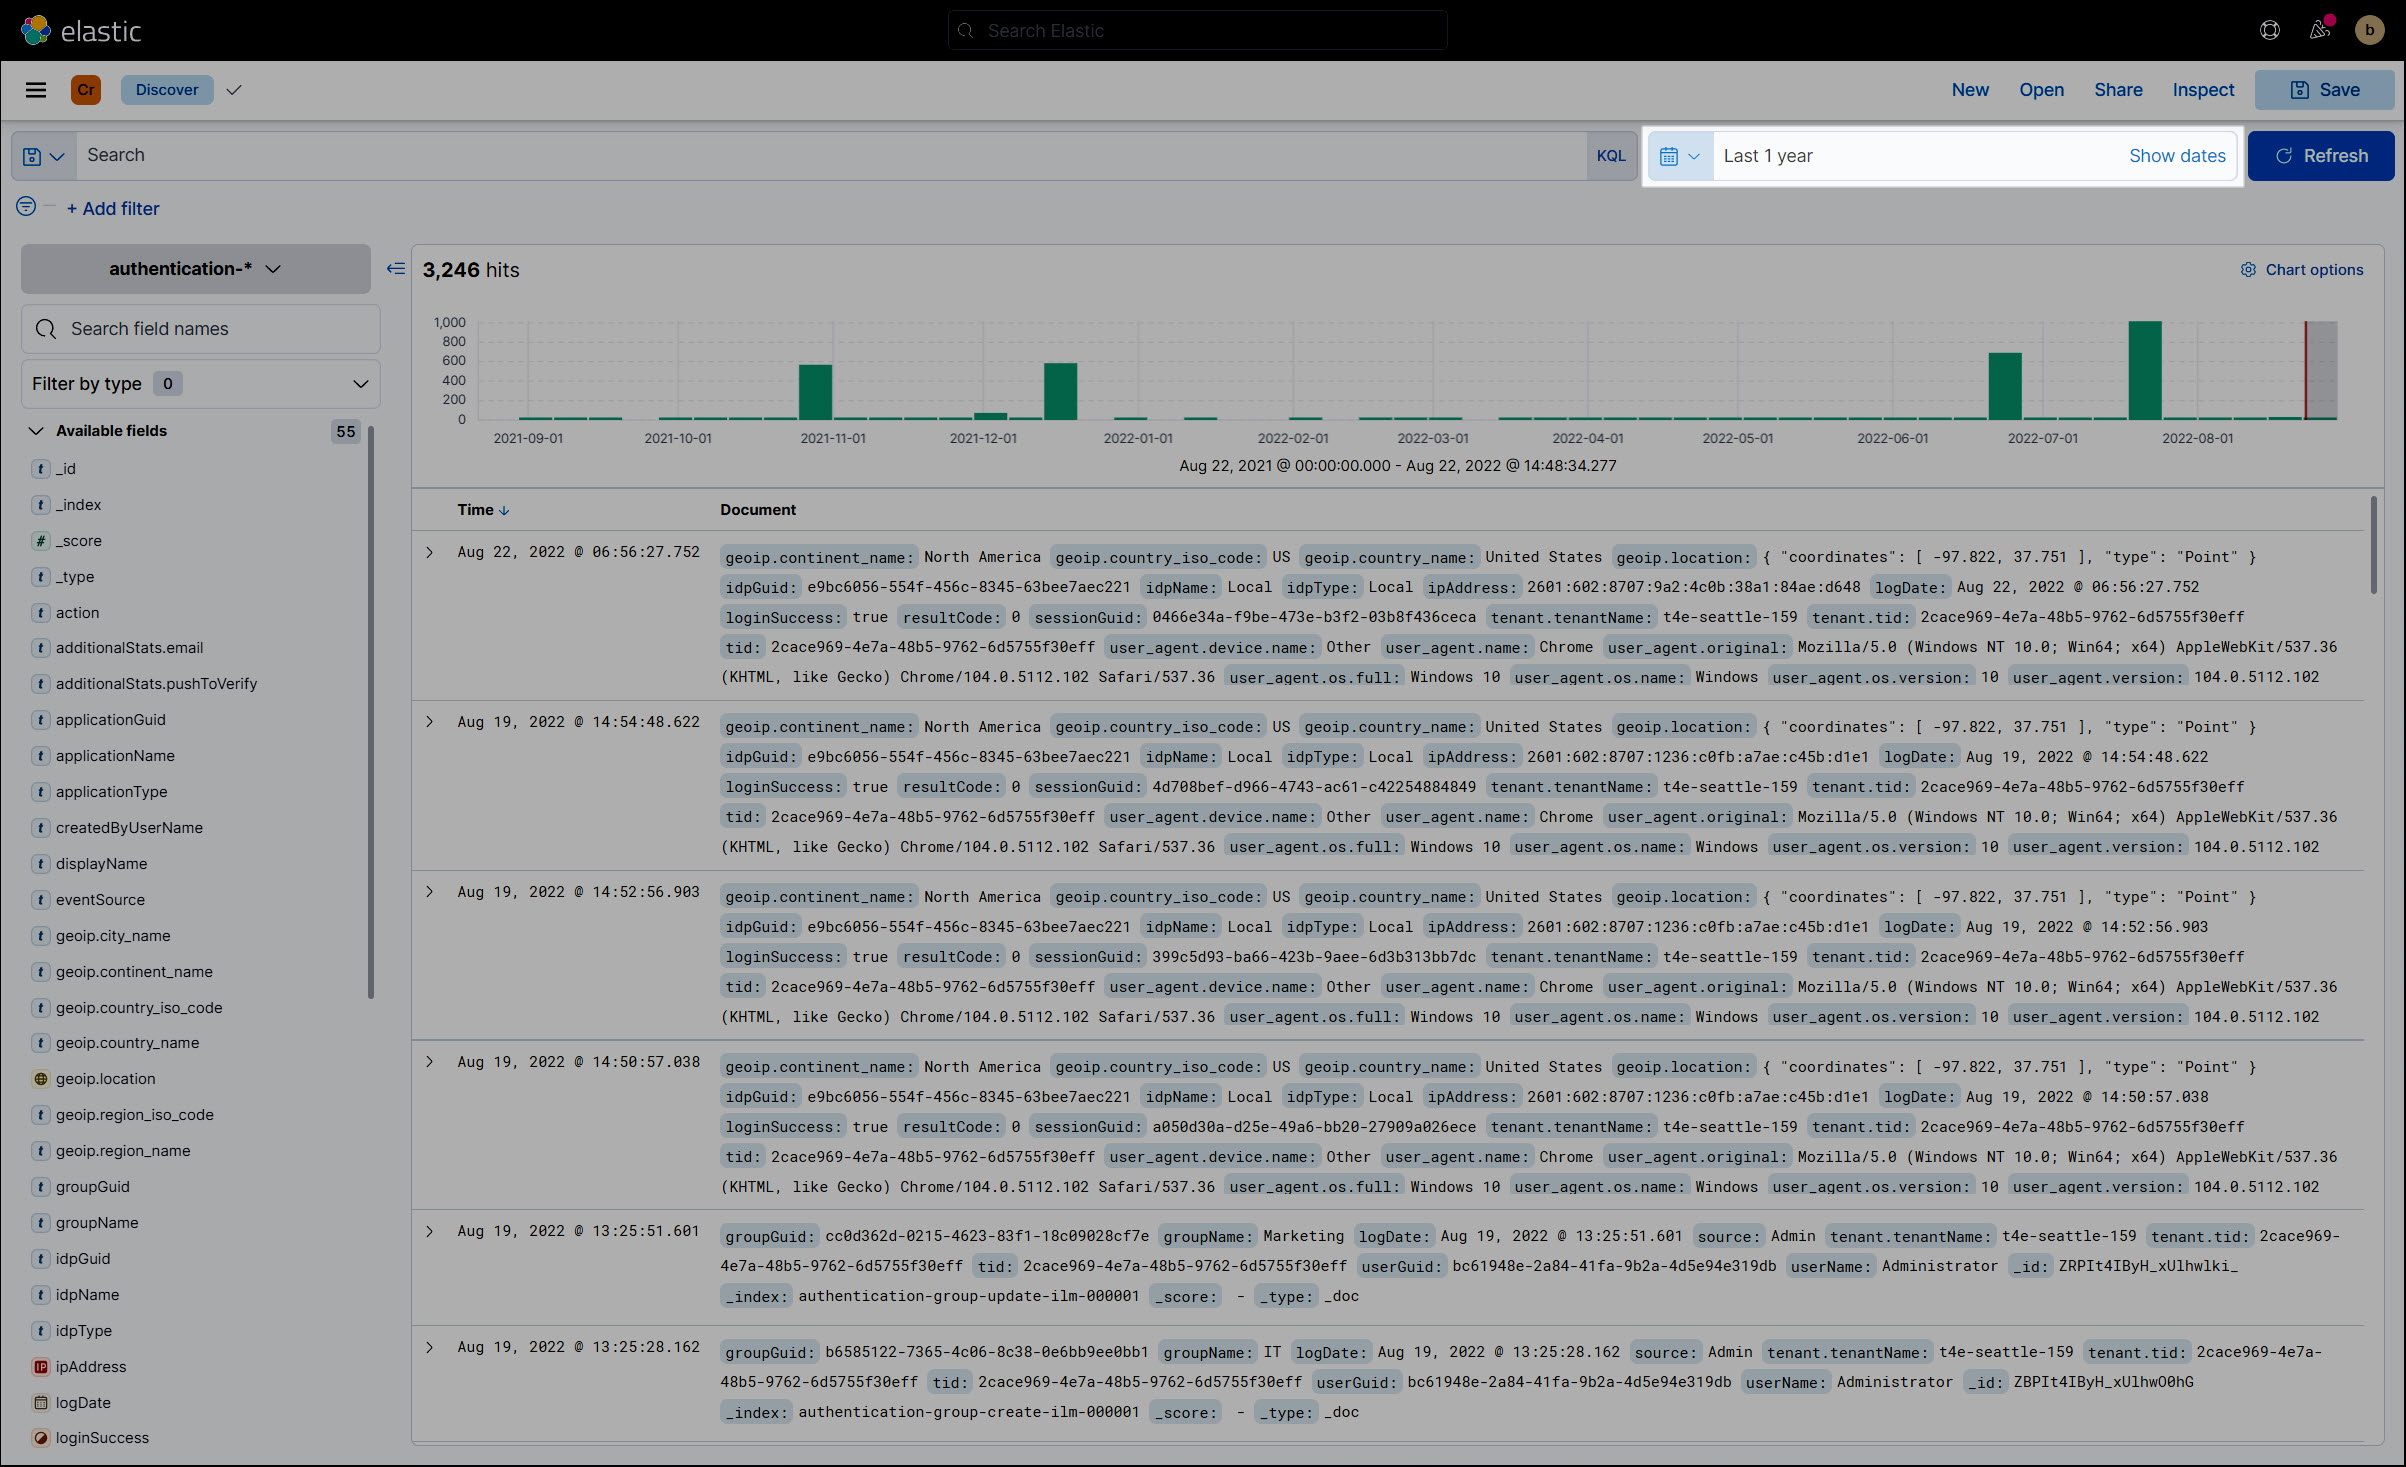
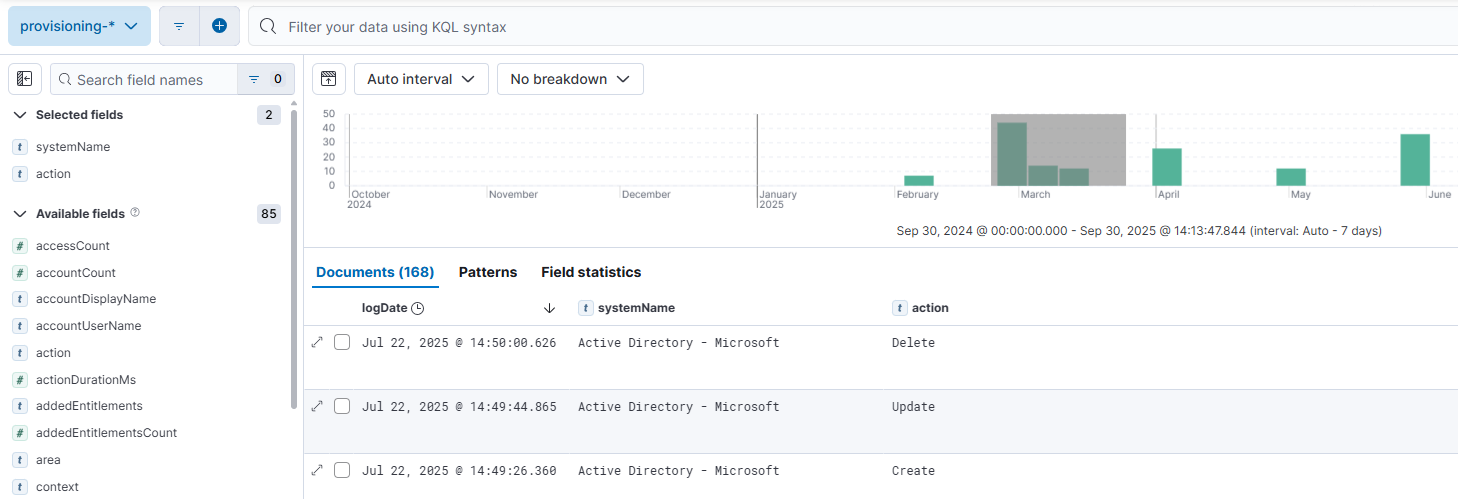
The date range chart at the top visualizes the number of logs per month/week/day/etc.
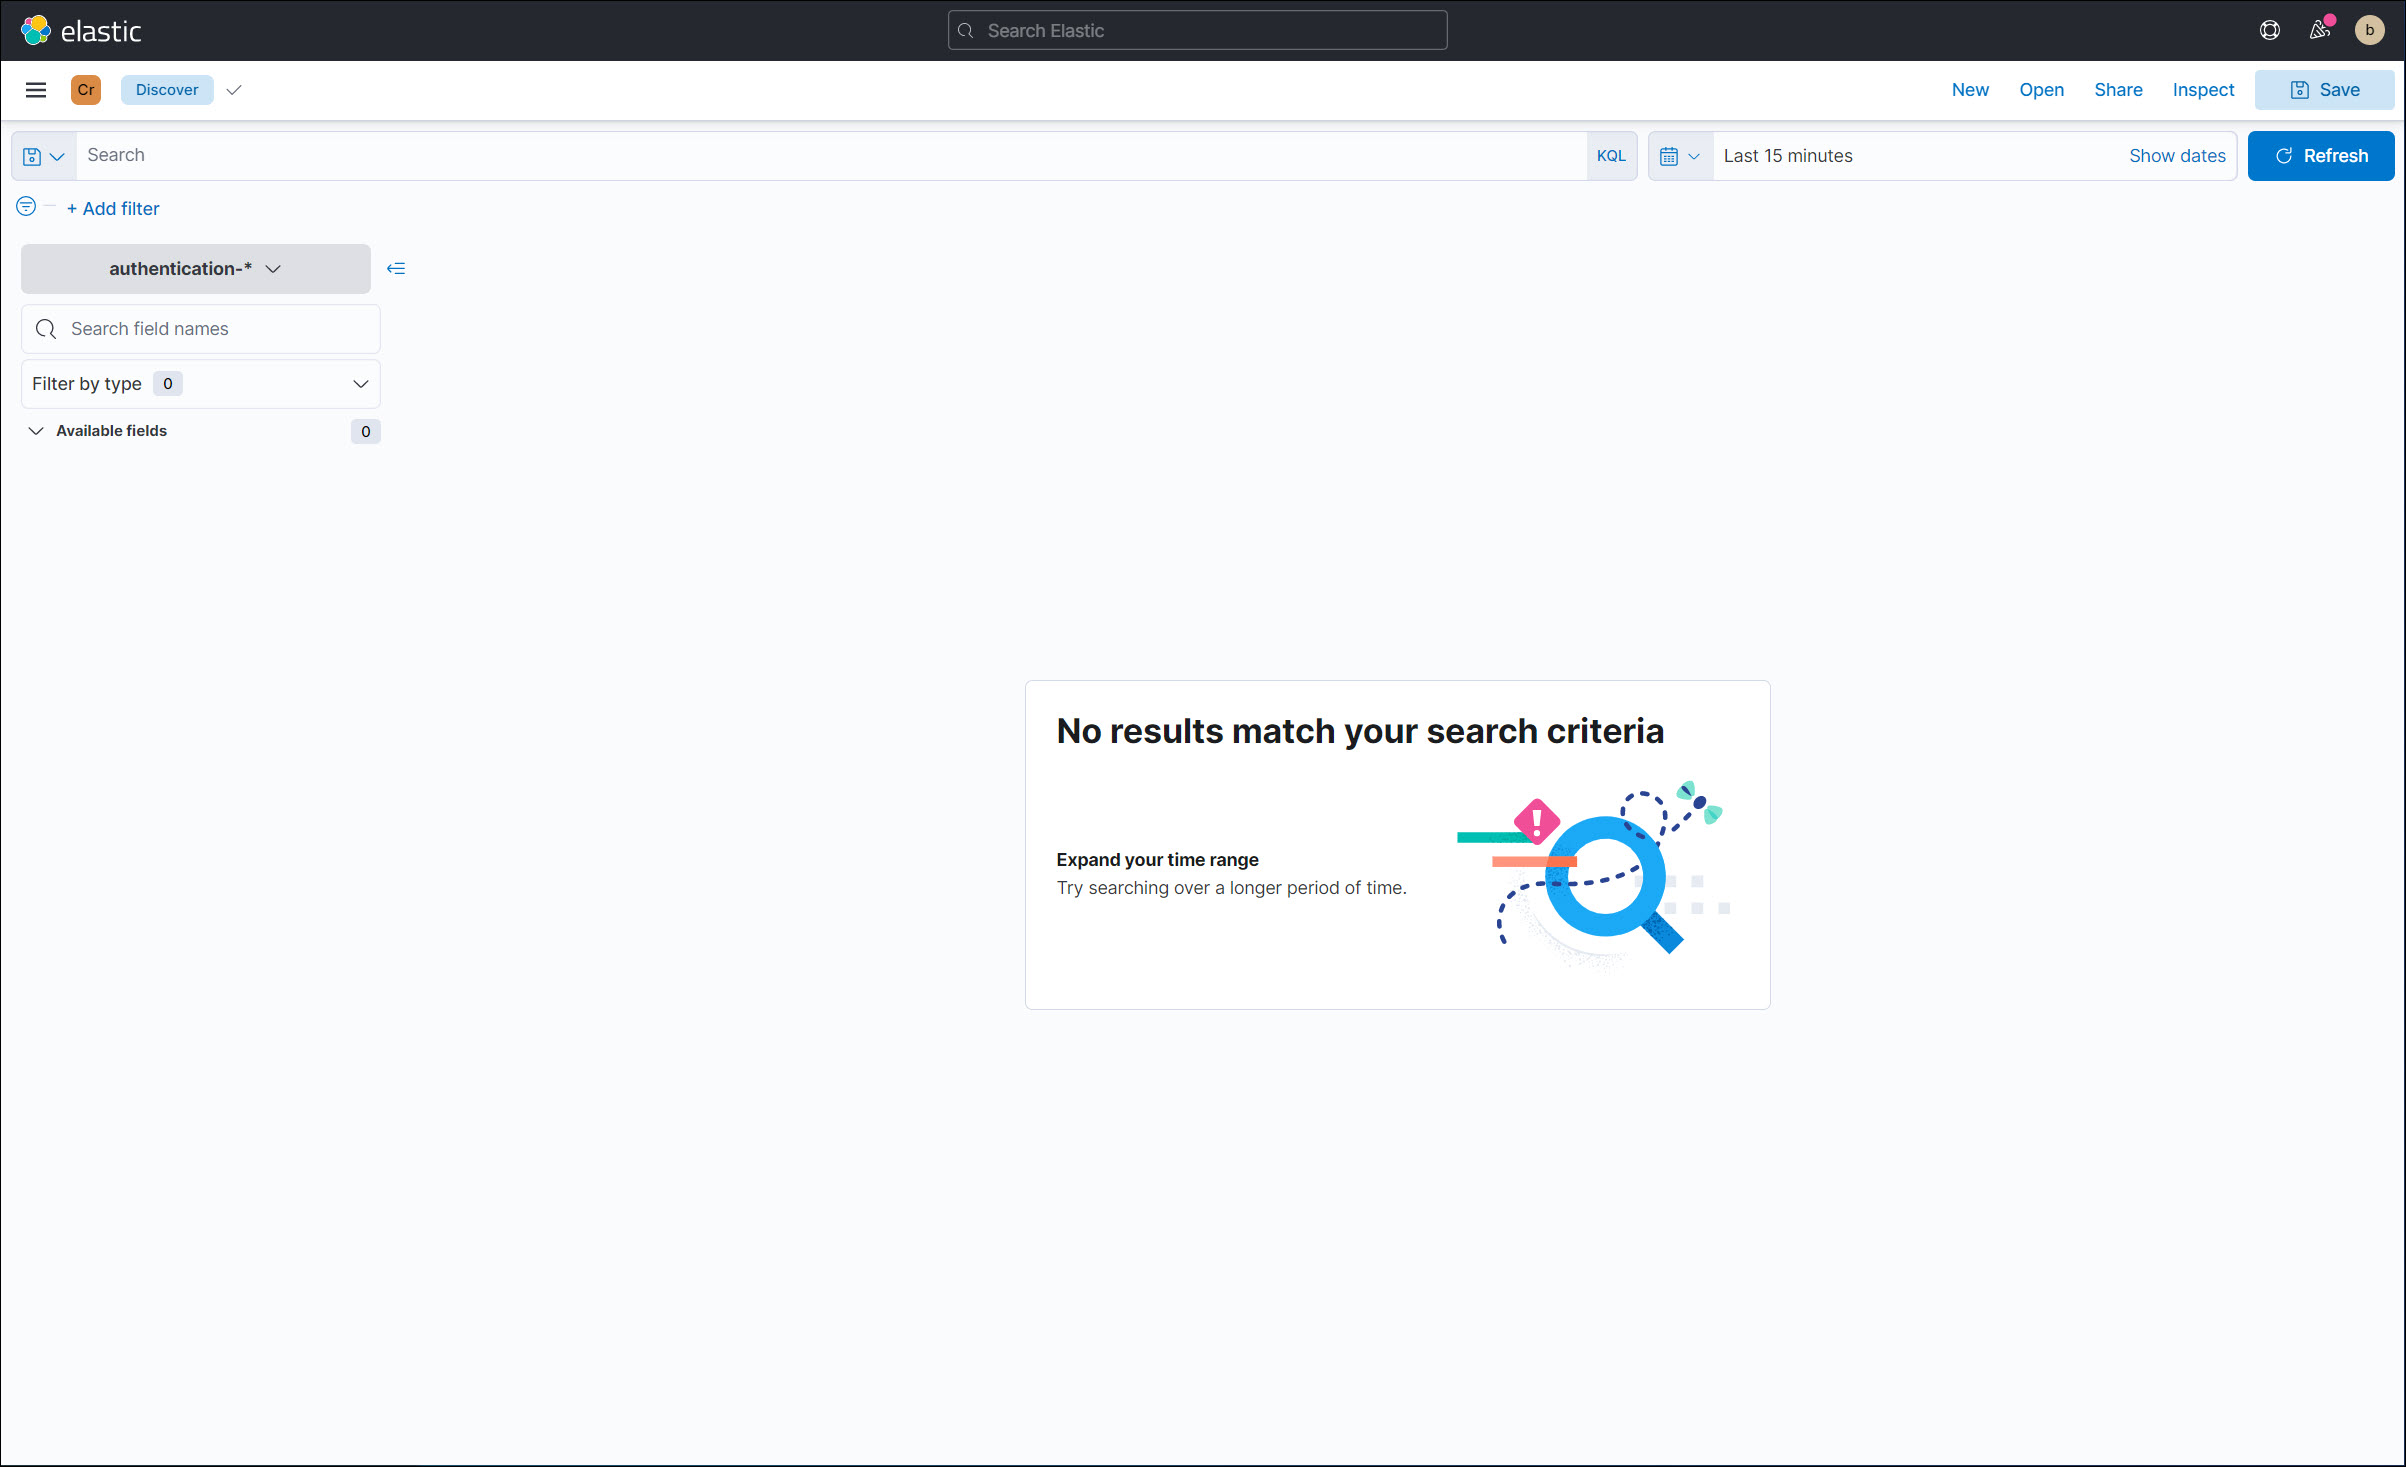
Optional: Click the Change Index Pattern dropdown to change the HelloID module (Access Management ("authentication"), Provisioning, Service Automation, or General).
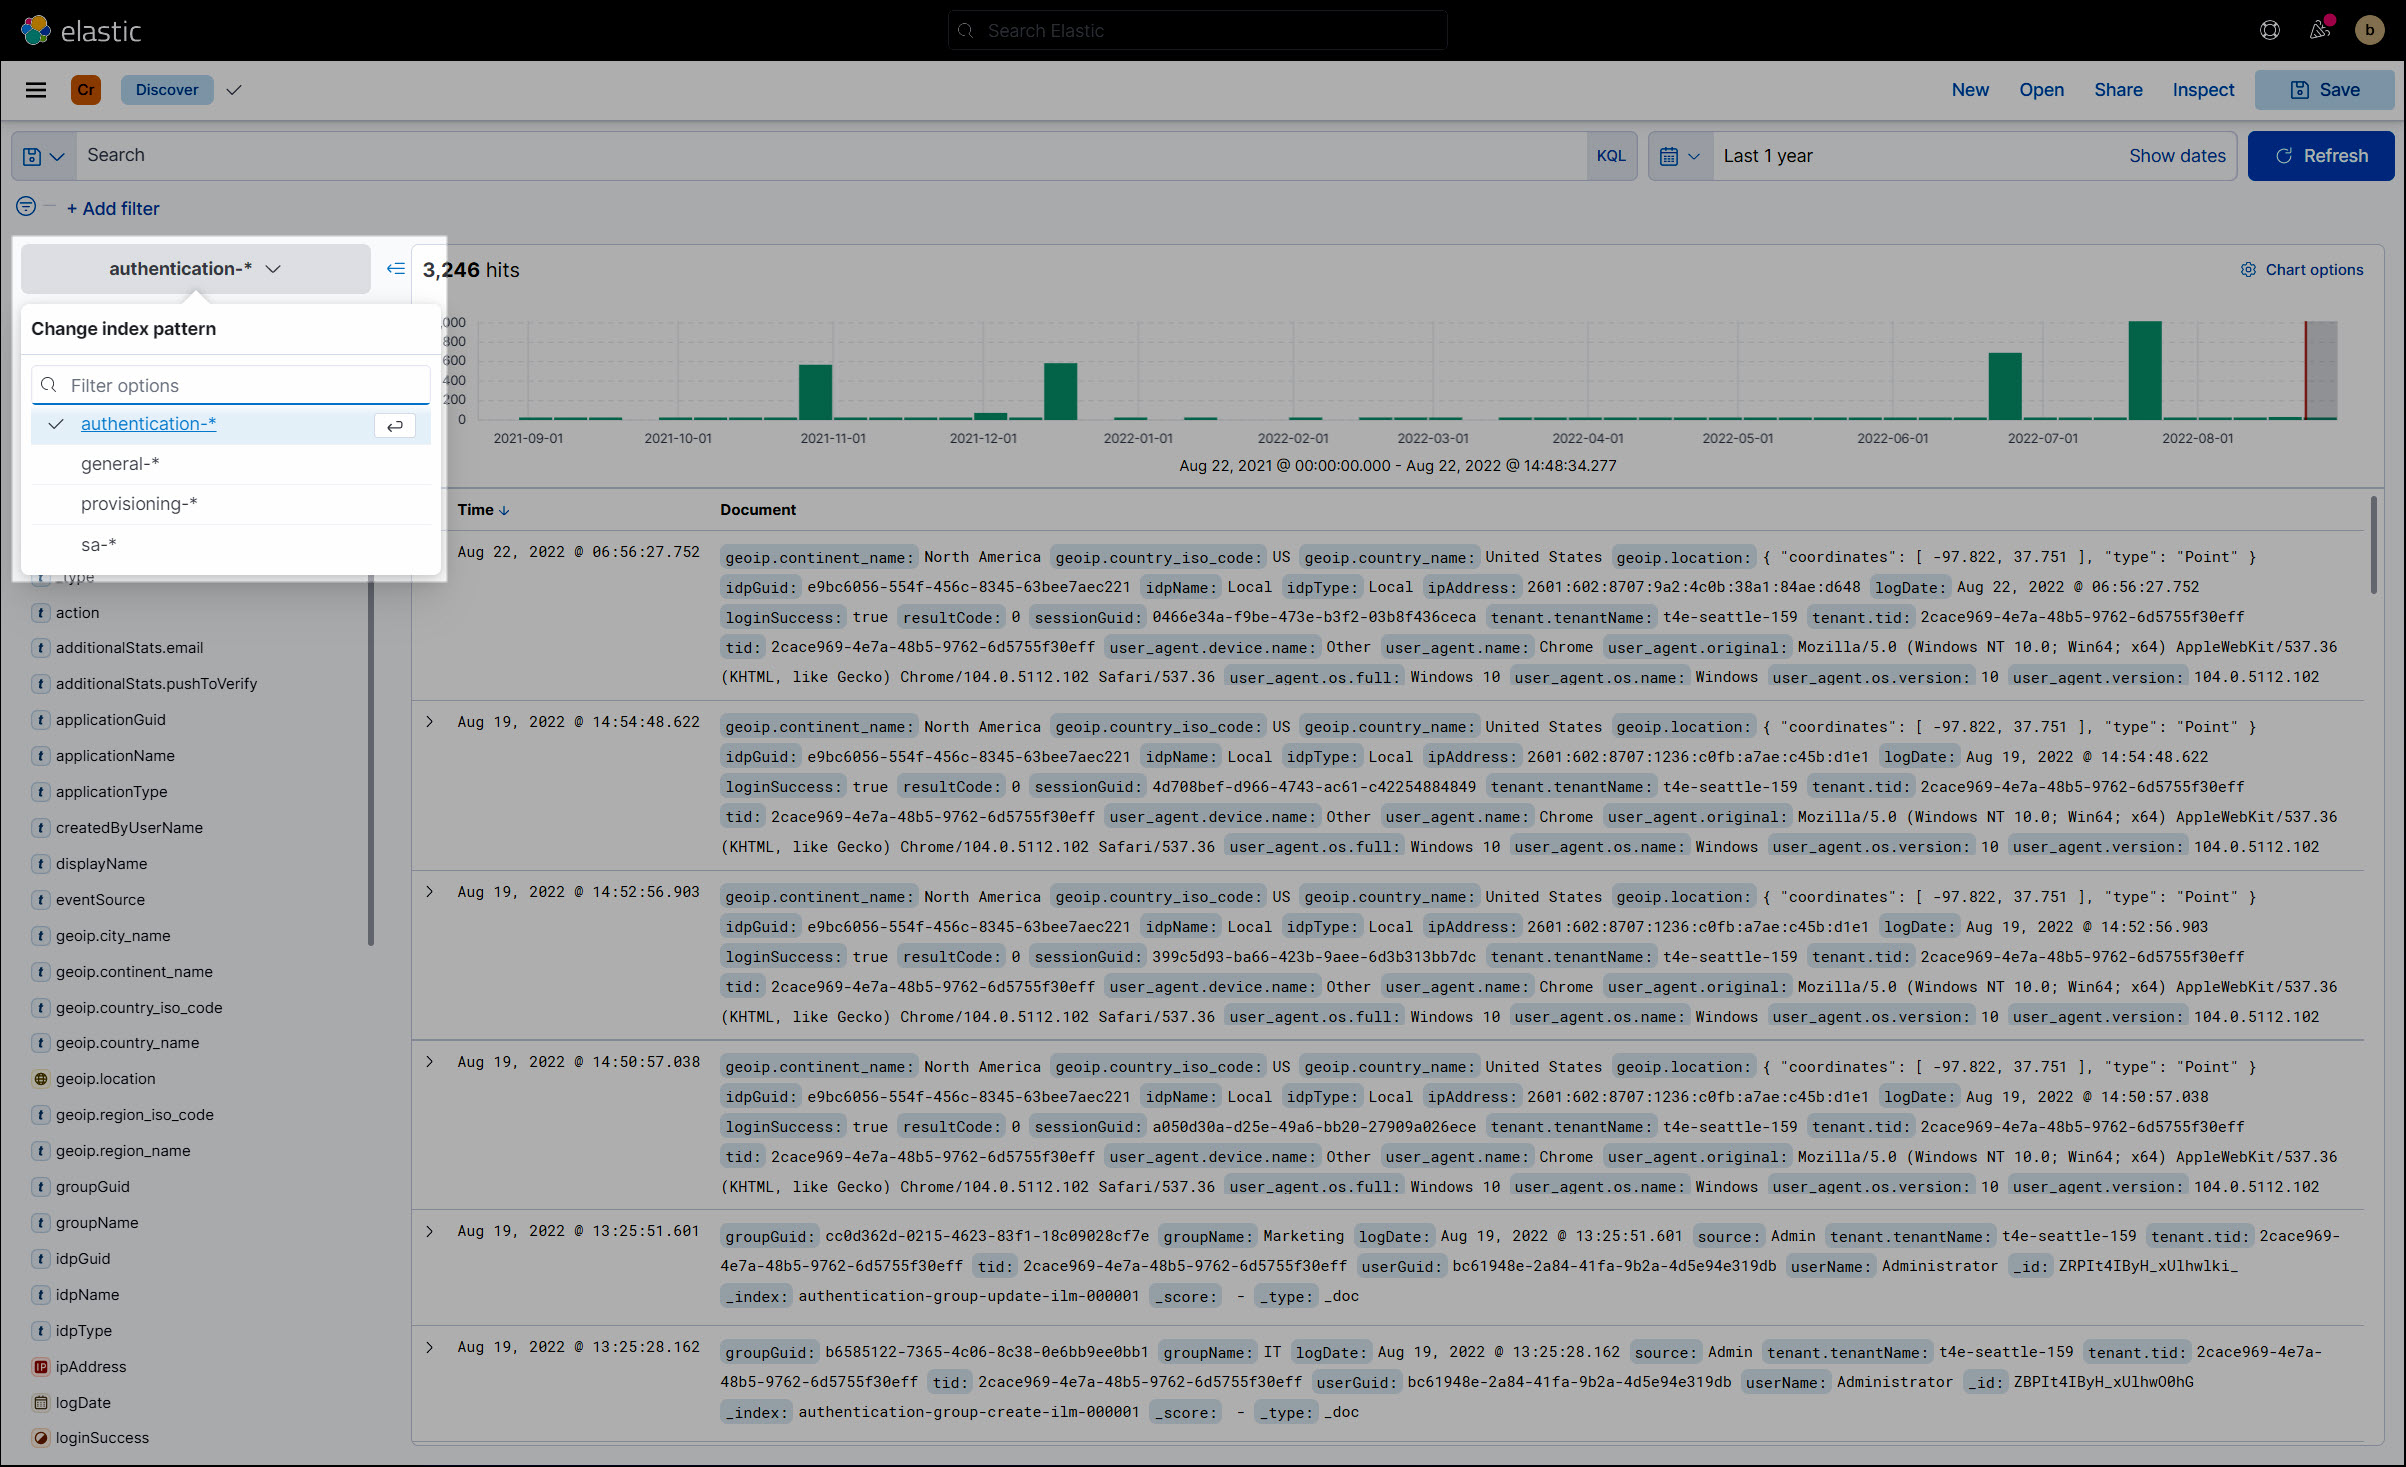
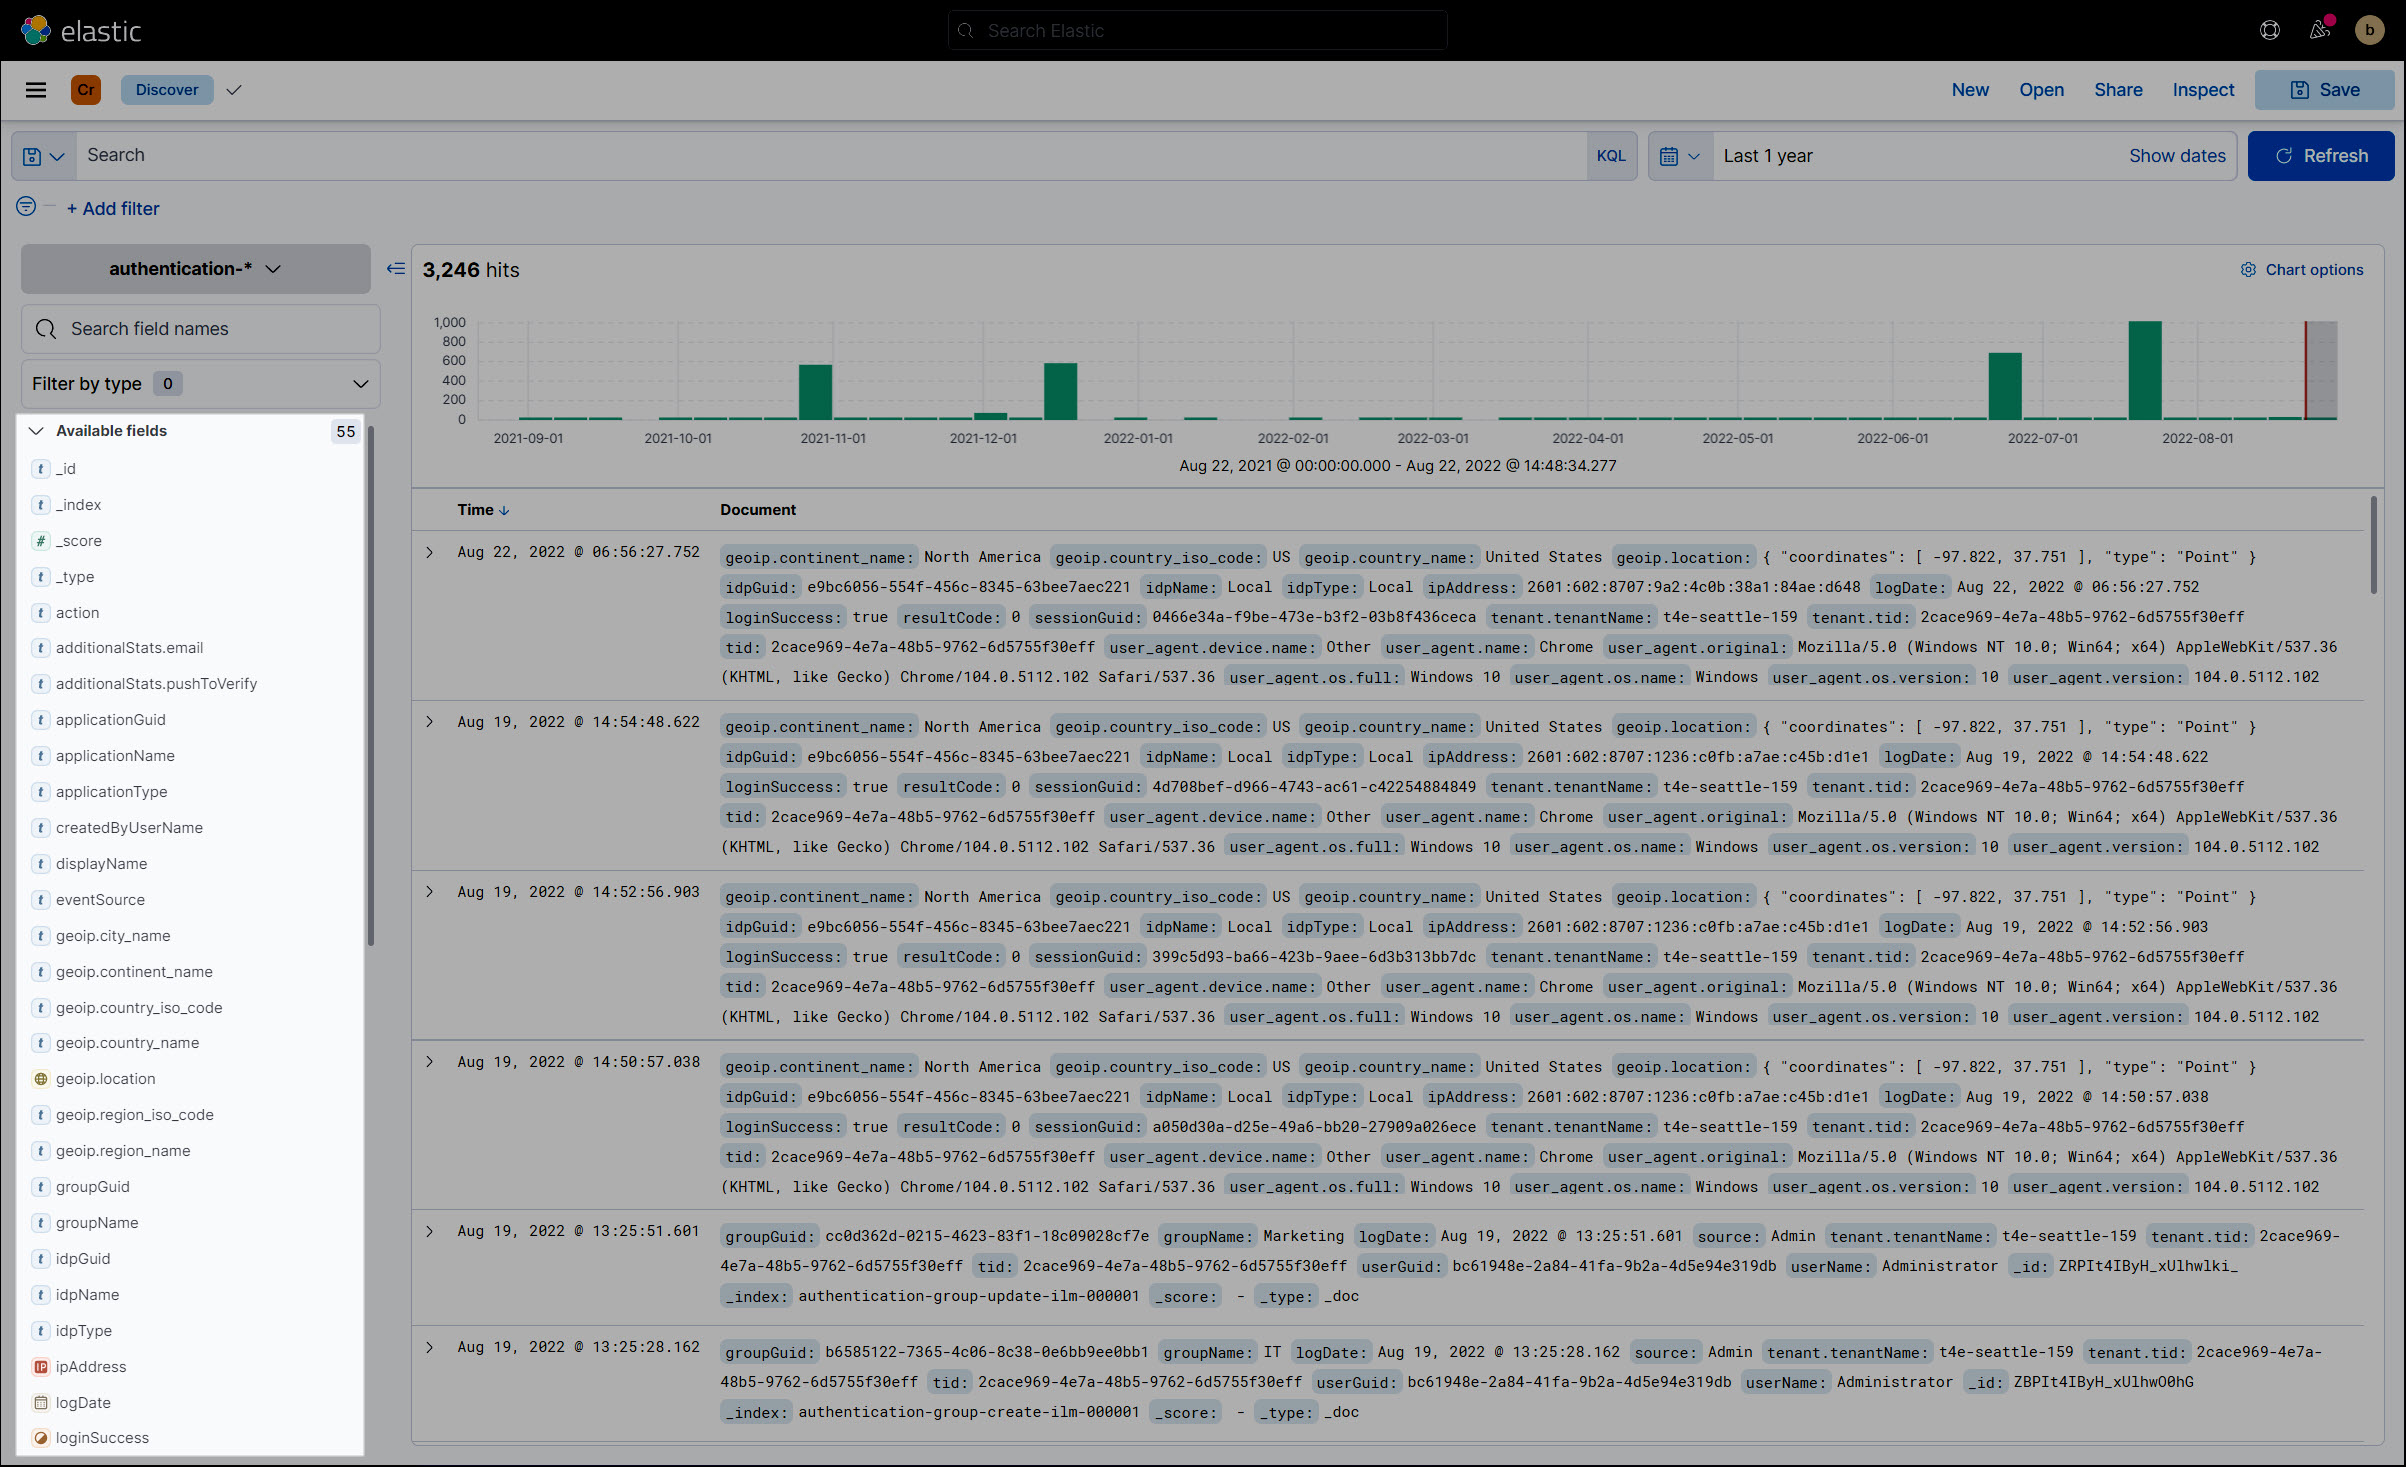
The Available Fields list is updated accordingly.
Tip
You can switch spaces using the menu at the top left. However, you can only create reports in a custom space.
You can now Filter data, Organize the data overview and use any of this data when you Create a custom report or troubleshoot an issue.
Tip
For an explanation of all options in Discover mode, see Explore fields and data with Discover on Elastic's website.
Filter data
The following are some ways to narrow a data selection.
Zoom in on a date range/time slot
Click and drag the mouse over a part of the date range chart to zoom in on it.
Search by index name
An Elasticsearch index is like a container that stores related documents, where each document is a collection of fields containing your data. Every index has its own name, which you can use use when running searches.
For a list of index names used in HelloID data, see Audit log data reference.
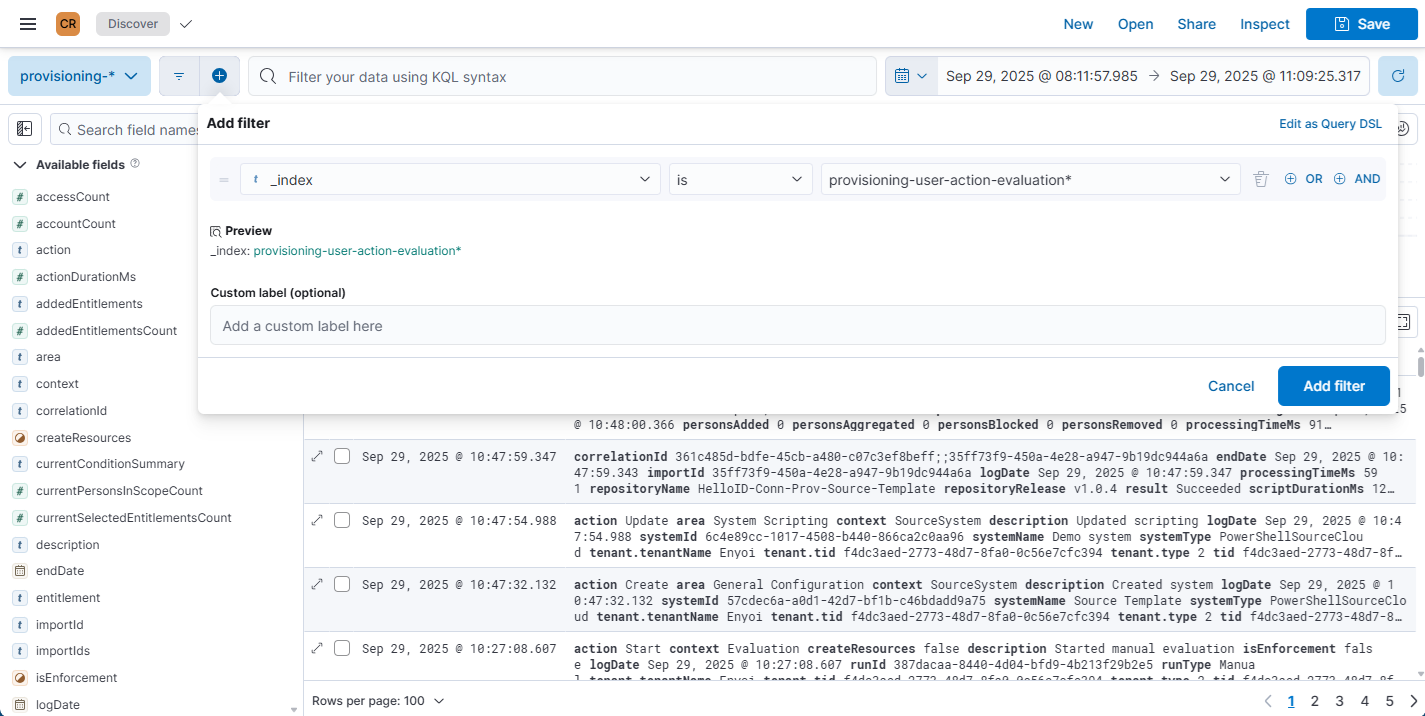
Click the + icon to add a filter.
From the field dropdown, select _index. For the operator, select is. In the value field, paste the index name, and press Enter. Then click the Add Filter button.
Many main indexes are organized into sub-indexes to provide more granular access to specific event types.
To find the sub-index of an entry:
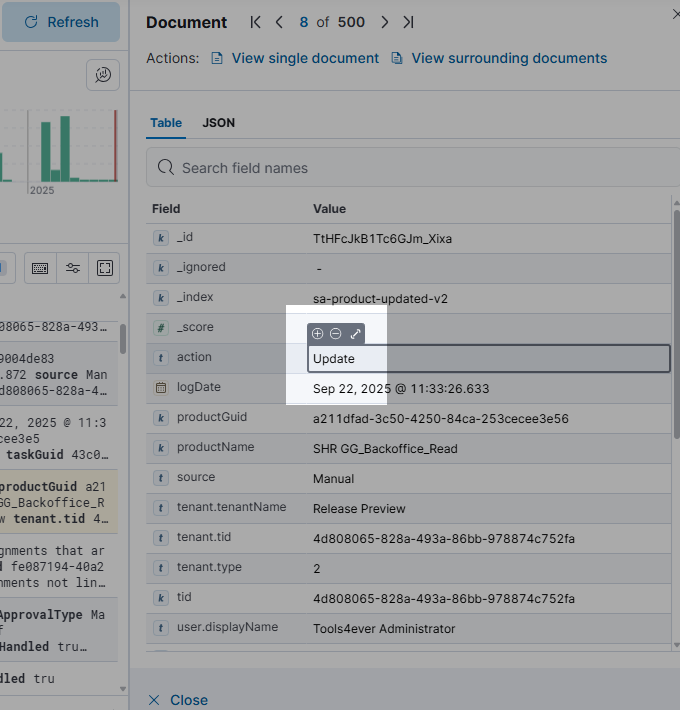
Click the toggle button to the left of an entry.
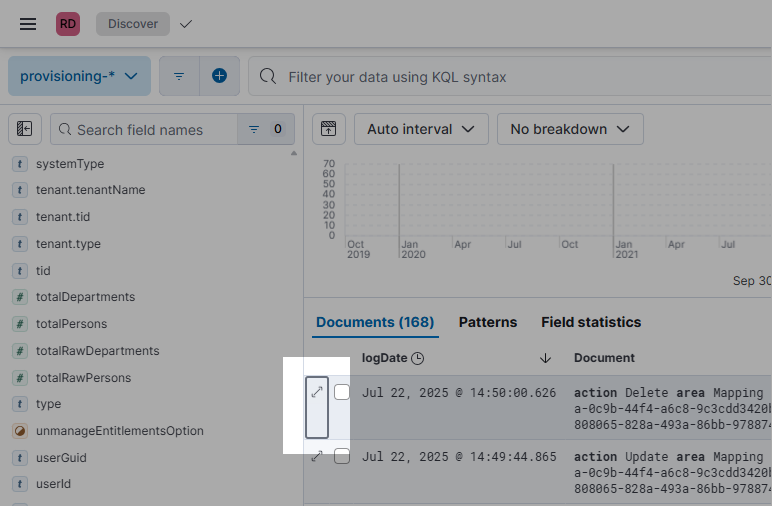
In the details, look for the _index field.
You can use the sub-index to Filter by value.
Filter by value
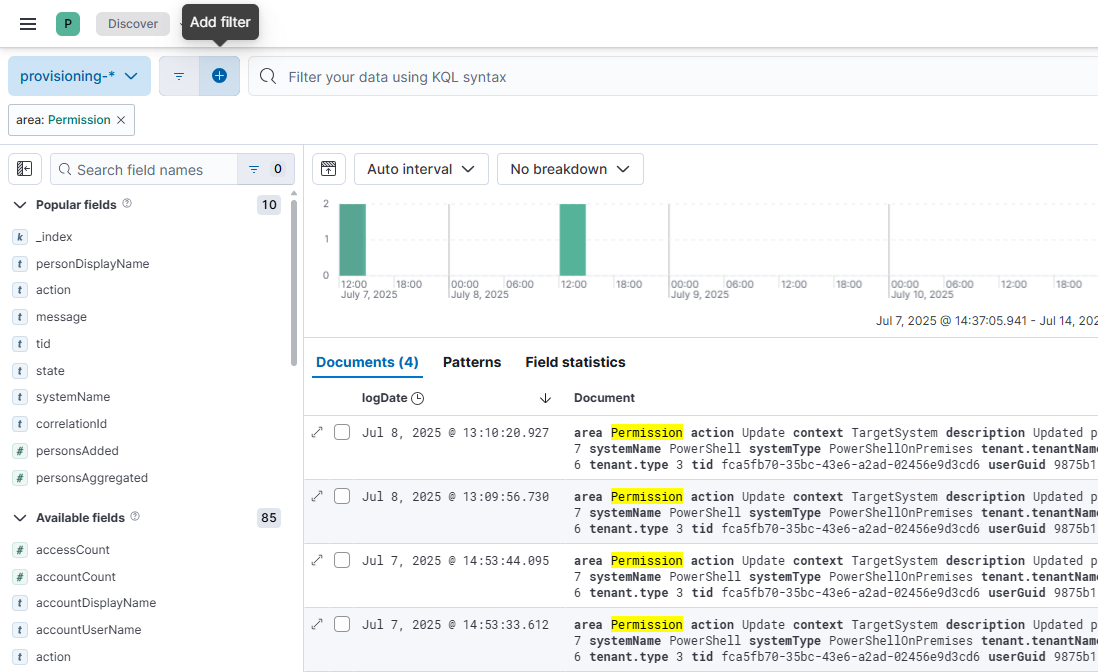
To find entries in which a field has a certain value you could add a filter as demonstrated in Search by index name, or use one of the following, quicker ways.
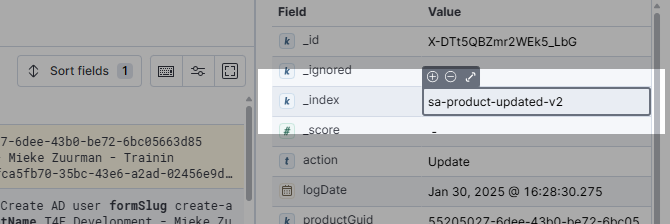
Click the toggle button to the left of an entry to open its details in a dialog at the right.
In the details dialog, find a field and hover over its value. Click the + icon to filter documents in which the field has that value. Or, click the - icon to filter documents in which the field does not have that value.
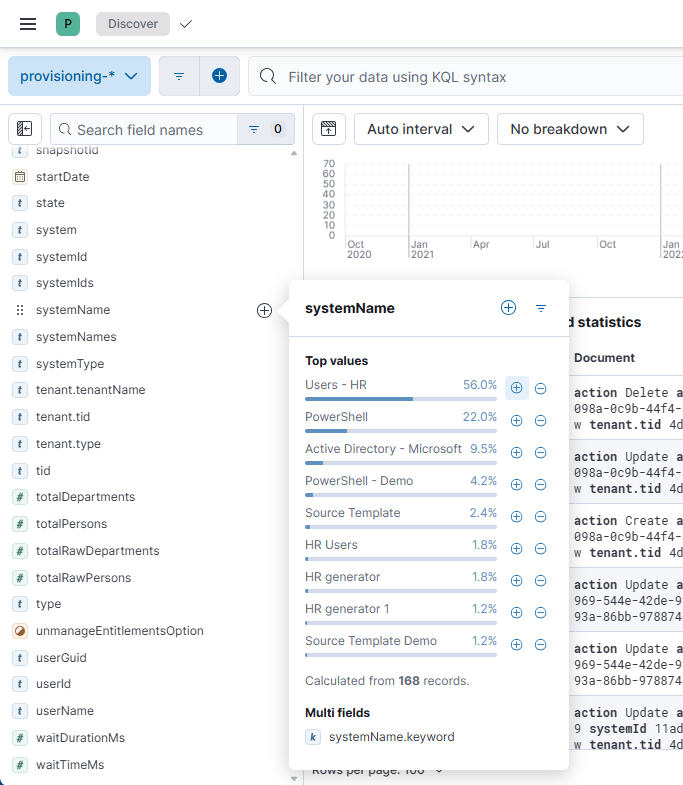
Click one of the Available fields at the left. In the list of values, click the + icon to show entries with that value or - to show entries without it.
Tip
Some useful fields for filtering user action logs in the Provisioning module are context, action and area. For a list of possible values, see Audit log data reference.
Enter a query
Enter a simple string in the query bar to search across all fields in the current data set. Use an asterisk (*) as a wildcard.
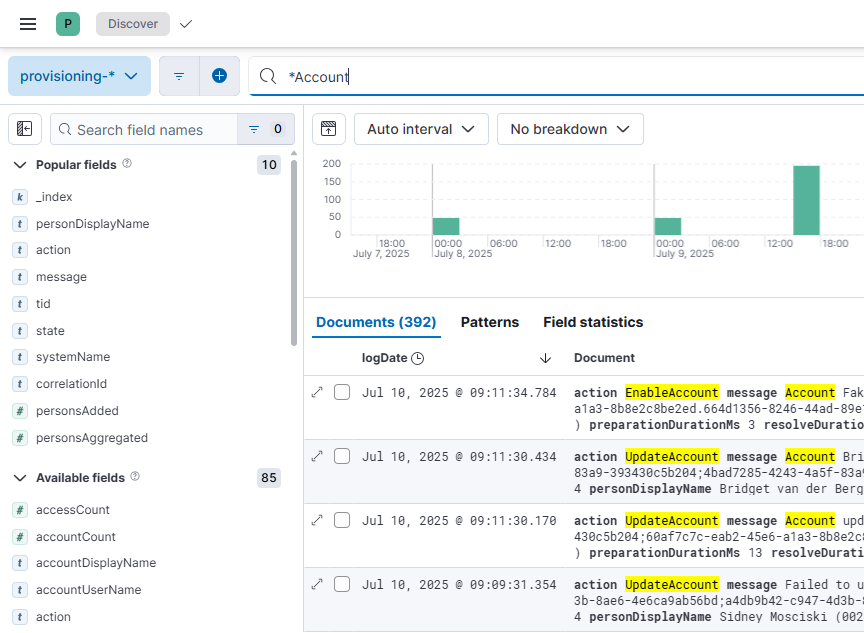
Click the Search field to expand it.
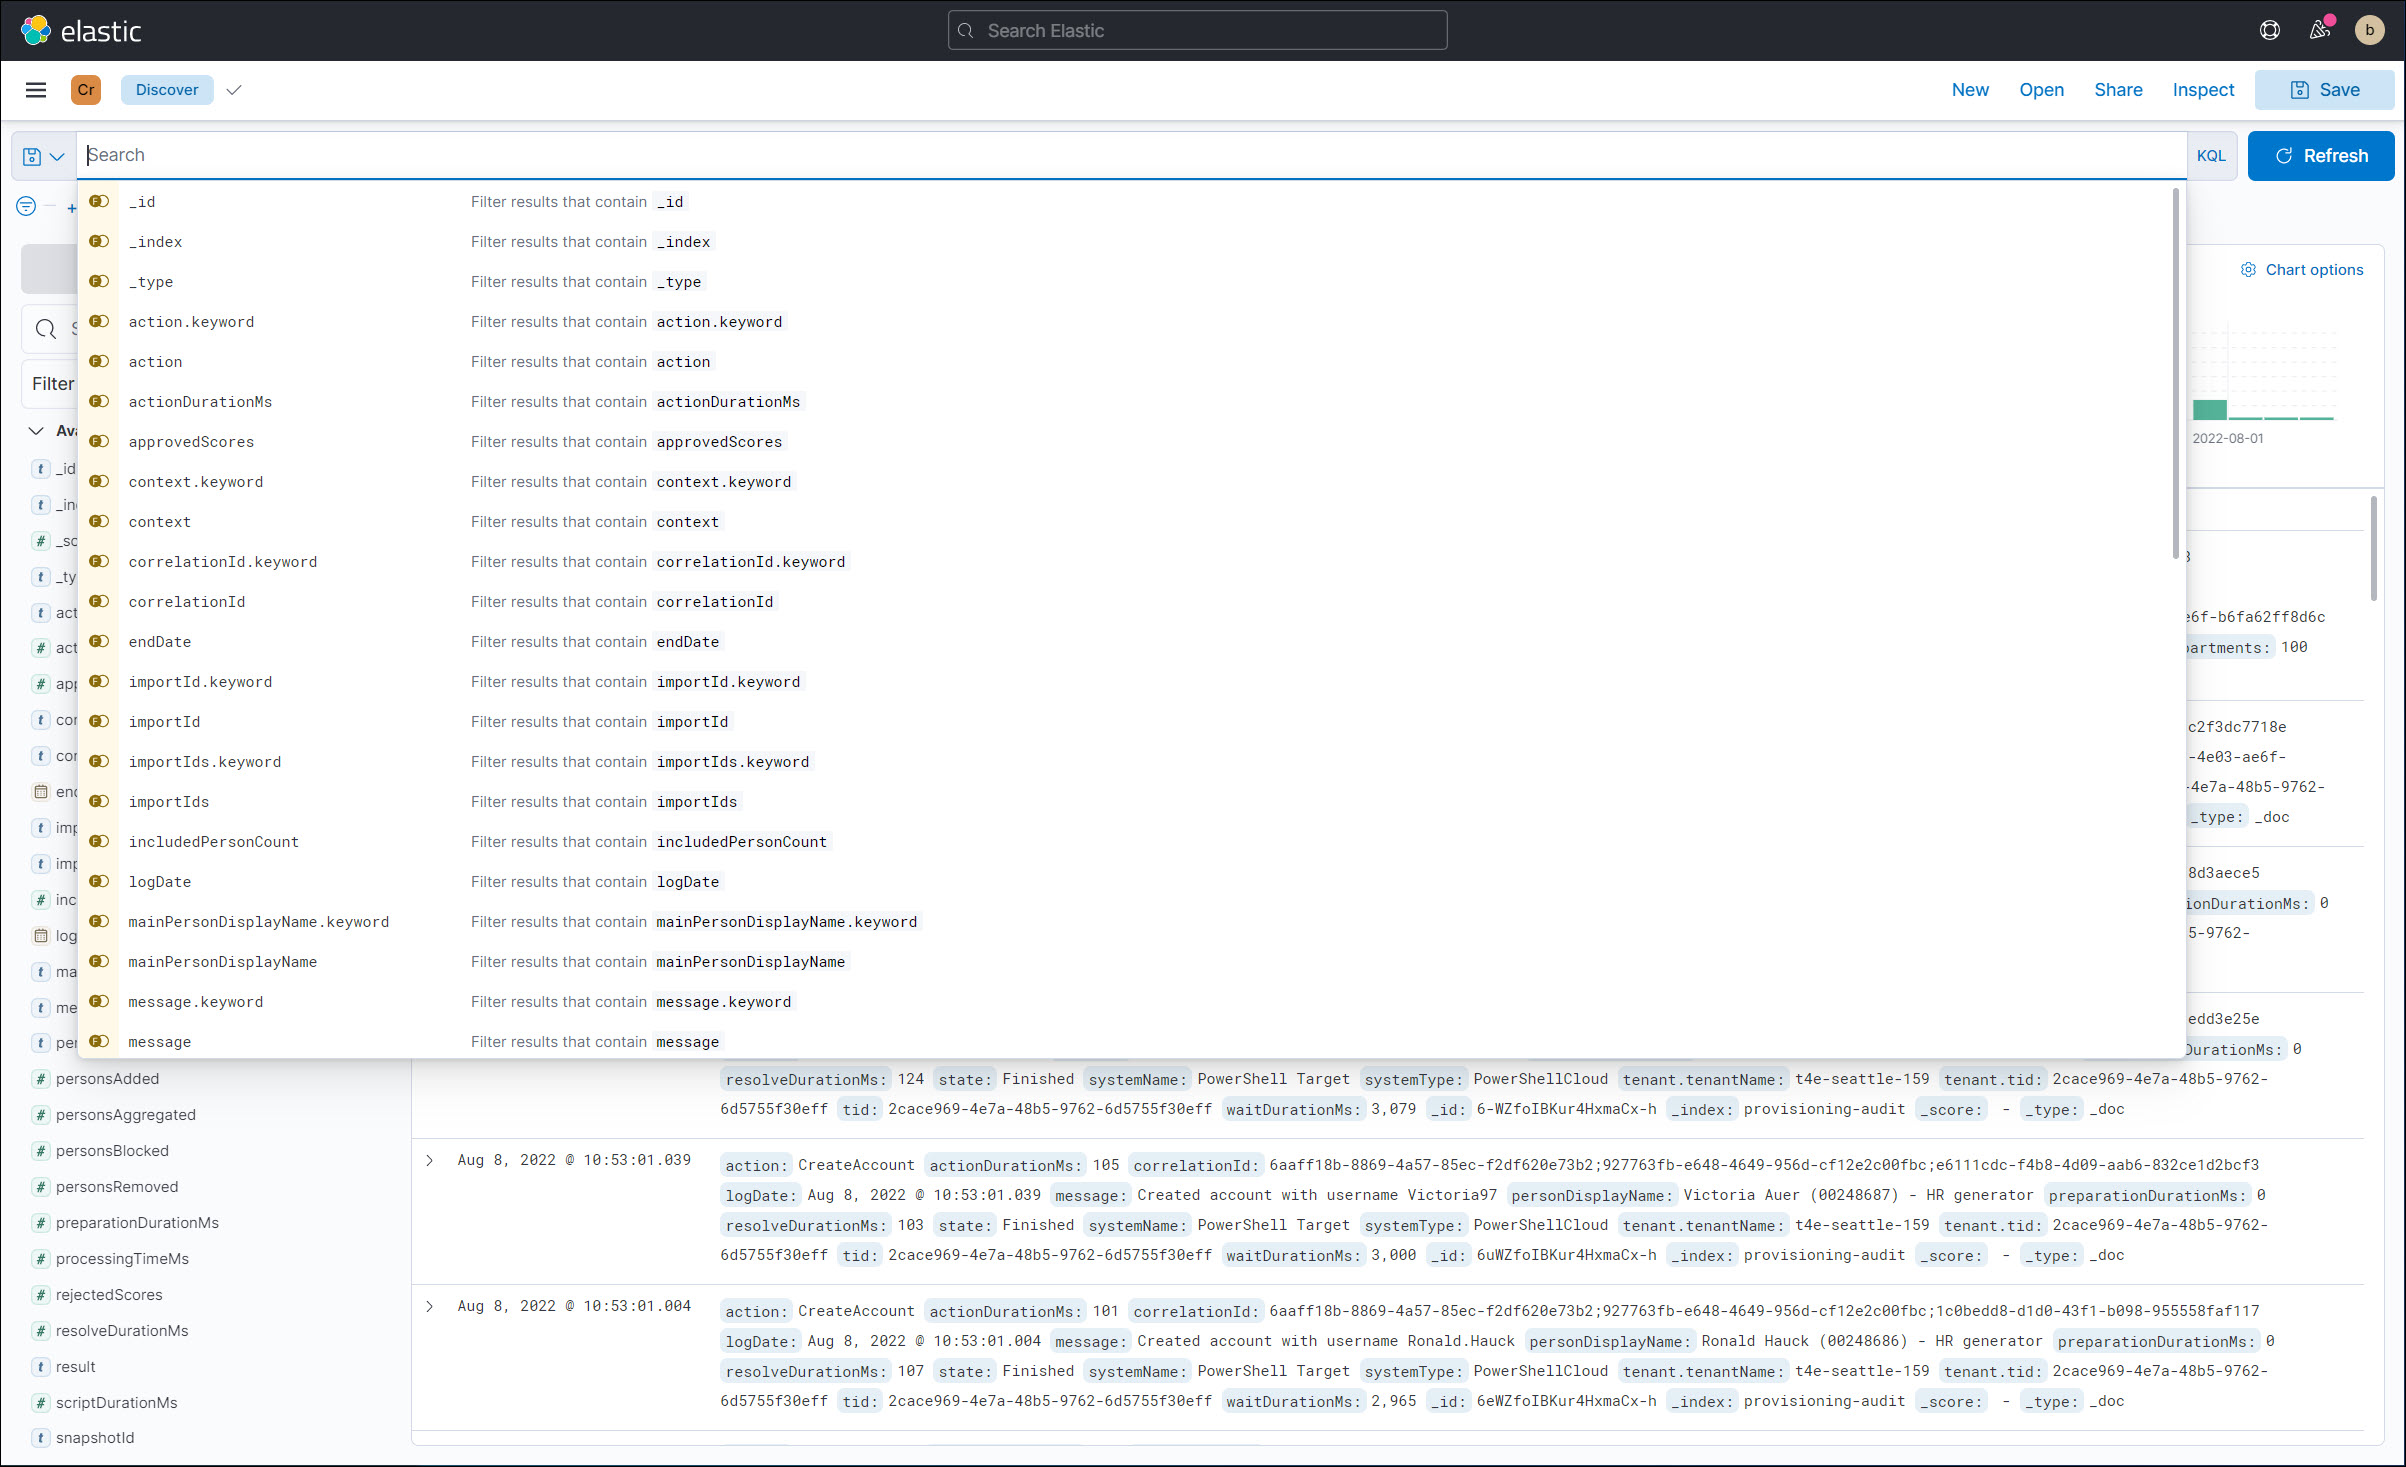
Use the Kibana Query Language (KQL) syntax to create a query, and then select the Refresh button. For example, the query
userName.keyword : *returns the following: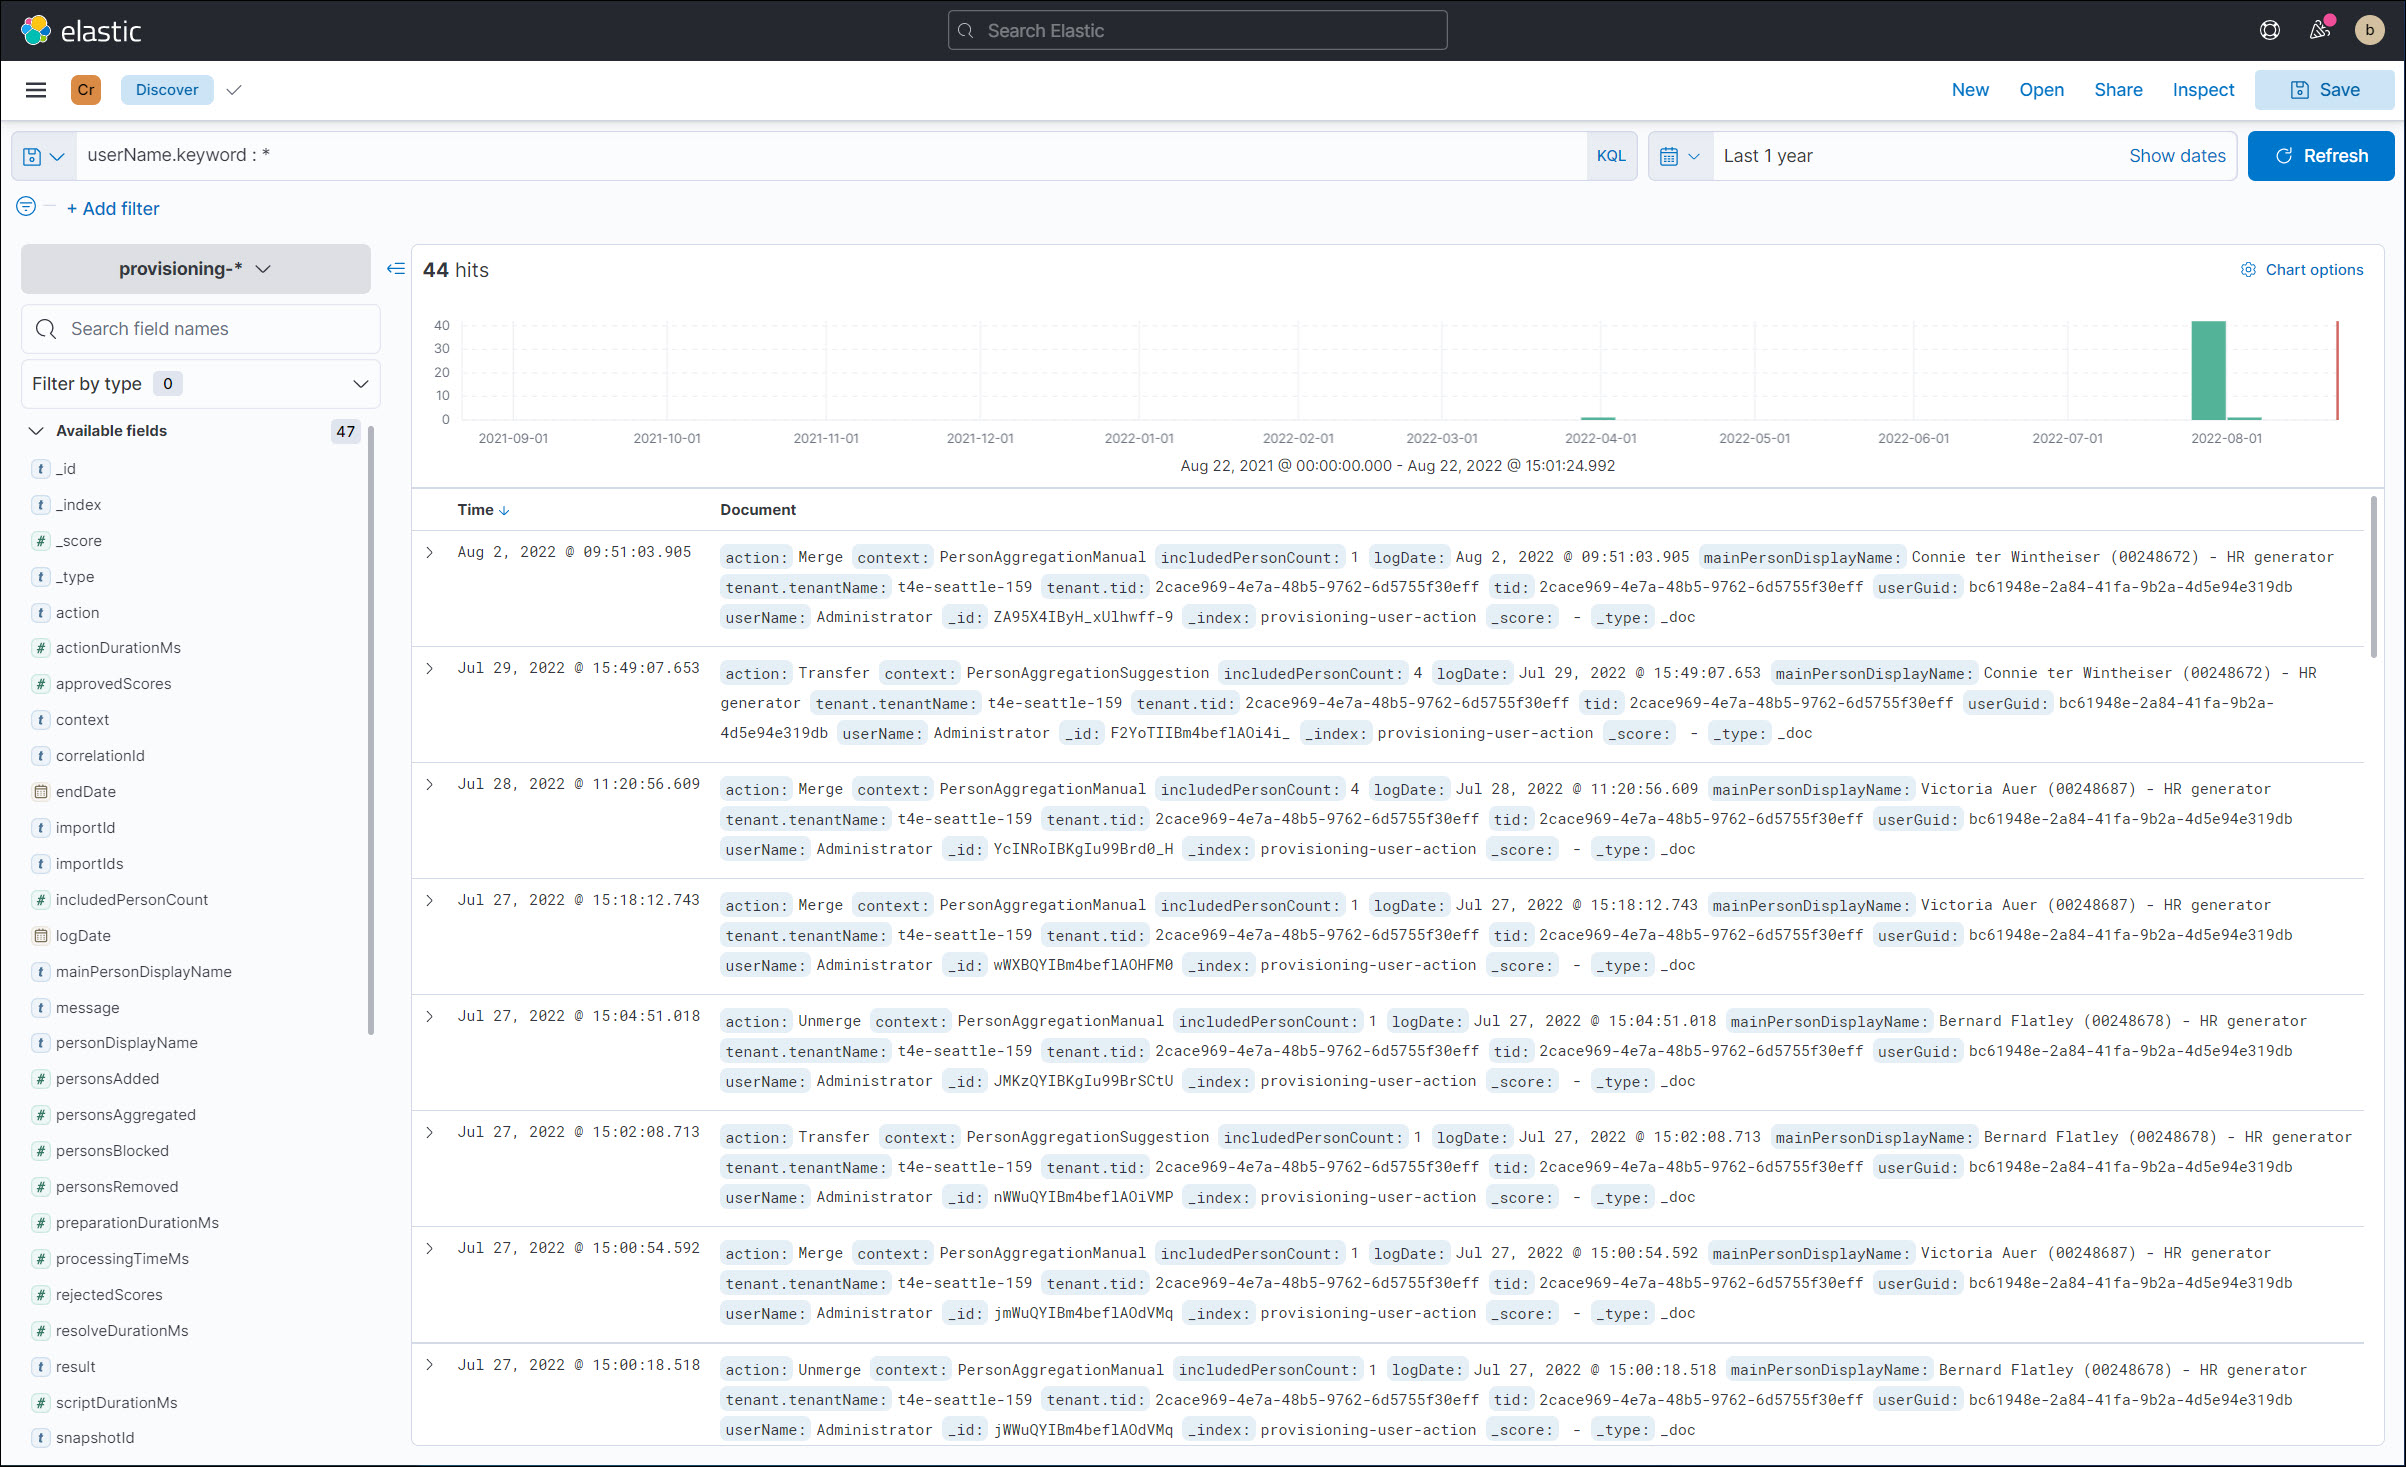
Organize the data overview
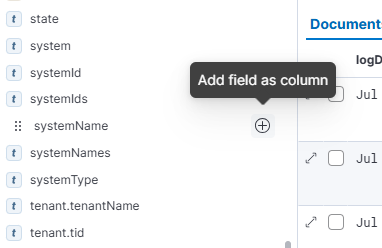
Add columns
Hover over one of the Available fields and click the + icon to add it as a column.
Alternatively:
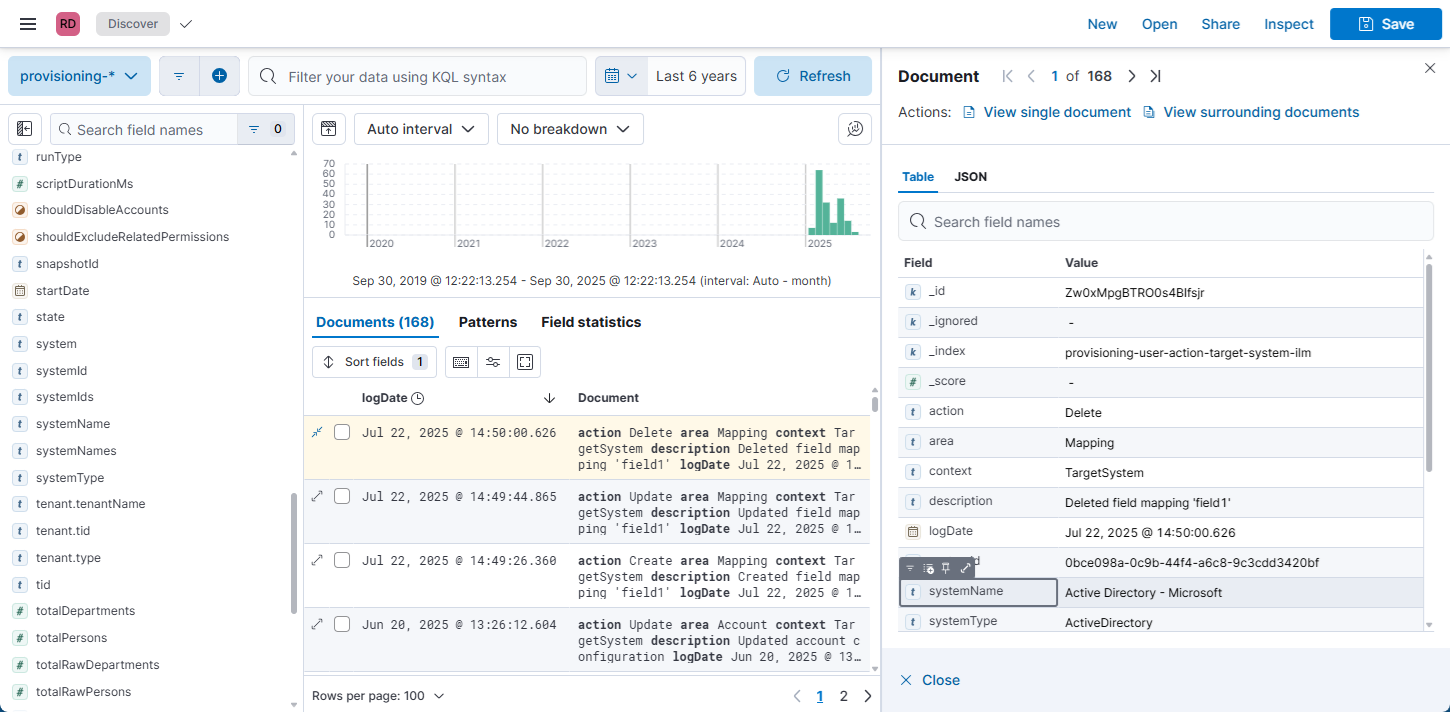
Open the details dialog for any of the documents.
Hover over the field in the details dialog and click the + icon.
Reorder columns
Click Columns and drag the items to change the order of columns in the overview.